British Columbia is YIMBYer than California
November 17, 2021 | #housing
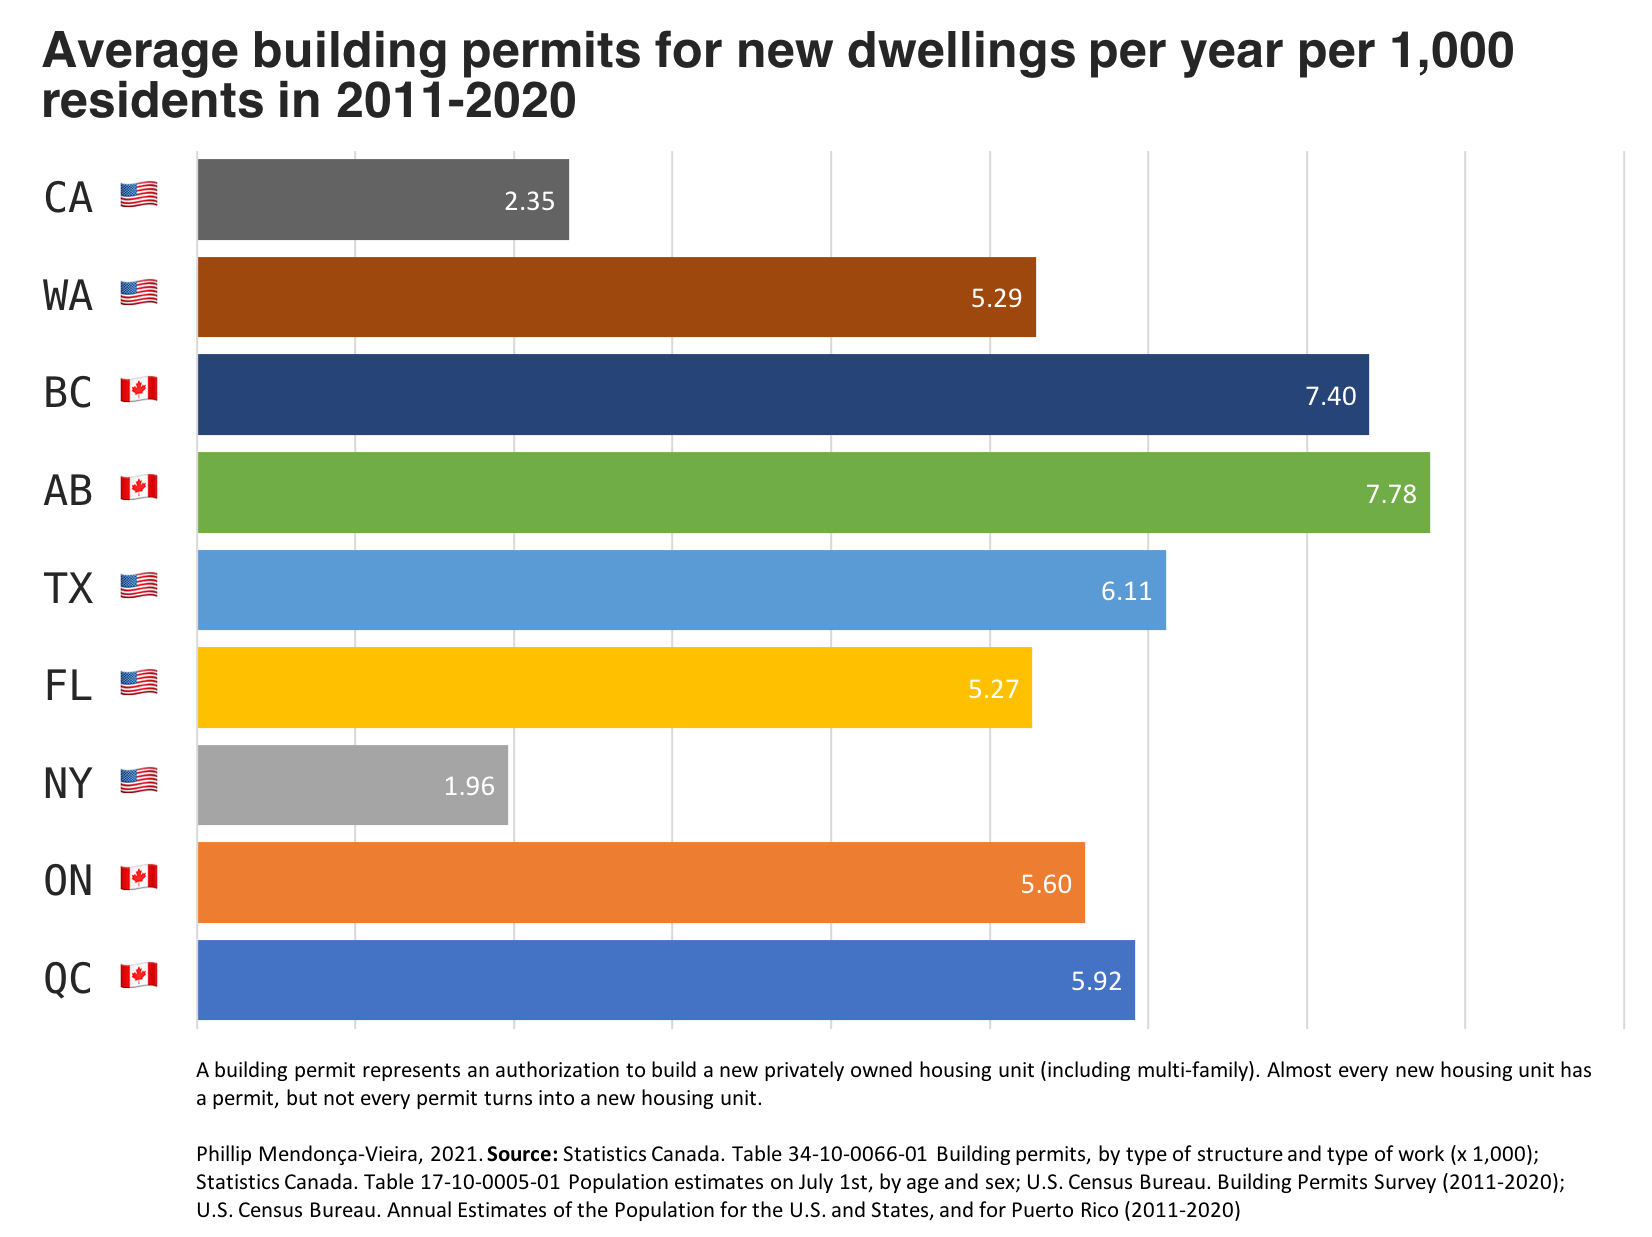
Comparing new dwelling building permits per capita per year between select U.S. states and select Canadian provinces
Canada is downstream of American culture, and Canadian housing discourse is no different. In the great, fiery, online fights about housing, Californians in particular are over-represented and tend to drive the terms of the debate.
And so, when it comes to our own online twitter housing discourse, many Canadians have noticeably “Californian” terms of reference. Namely, folks tend to adopt a semi-reductive fixation on the supply of private market housing, which is being severely stifled by excessive deference to the interests of incumbent, NIMBY homeowners.
This is fine as far as stylized causal narratives go. But if we’ve adopted the same causal narratives, how do our housing markets actually compare?
In other words, how bad are our NIMBYs, relatively speaking?
On close examination, using new dwelling building permits as a proxy for new housing construction, I find that on average Canadian provinces produce way more housing than California or New York state do:
(Click here for a copy of the spreadsheets.)
For the average California YIMBY, the status quo in British Columbia is a success condition: BC on average issues three times more building permits per capita per year than California does.
Motivation
In 2017, I became somewhat familiar with Canadian housing statistics and academic literature, and one thing I learned while writing about rent control is that every jurisdiction manages to do things differently. As I continued to see American commentators cite Toronto and Vancouver as positive examples worth emulating, I developed a vibe that our housing crisis must have some important qualitative differences, too.
In particular, I was fairly confident that Canadian cities produce a lot more housing, relatively speaking, than their American counterparts. The other day I got into a twitter conversation with Jens von Bergmann, and it occurred to me that I could try to sketch this out.
Hypothesis
If Canadian cities produce more housing, relatively speaking, than similar American cities, then this should stand out if we compare their construction statistics.
Housing regulations are highly localized and so ideally we’d compare individual cities directly. But when making international comparisons definitions like “what is a city?” can get pretty flimsy. Also, we’re just interested in the general picture. These kinds of differences ought to show up at the sub-regional level, and entities like provinces or U.S. states tend to have more stable definitions than metropolitan areas.
Because provinces and states have different sizes, comparing absolute numbers isn’t particularly meaningful. We’ll need to normalize housing unit construction statistics by each area’s respective population. Also, housing construction rates can vary a lot on any given year, so we’ll have to average our statistics across a bunch of years.
Methodology
An important caveat is I had to time box this analysis to two hours, which is all the time I had while the baby slept.1
OK! Let’s find some data. We are interested in the regulatory bottleneck to new housing, so I figured we could use new housing starts, which are easy to get from the CMHC website. All I had to do now was to find a source of new housing starts data for U.S. states.
I searched for variants on “california housing starts statistics” for a good half an hour without finding anything useful. I was surprised there’s no equivalent to our reasonably decent StatCan website. There’s a FRED table but seemingly no way to break it down by state. There’s the New Residential Construction data release, but the only available breakdowns are by region and not by state. Weird!
Surely I’m missing something? American researchers seem to have access to all sorts of interesting surveys and data series on rental prices and residential construction that we lack. Maybe data is only aggregated on a state by state level; maybe you need to know a guy to get it. Either way, I couldn’t find any one-stop-shop portals with historical data on housing starts or completions with state-level (or MSA-level) granularity.
What I did find was the Building Permits Survey, which should be a rough proxy for actual building starts.2 Poking thru StatCan yielded Table 34-10-0066-01 Building permits, by type of structure and type of work (x 1,000) whose definition seems to be roughly equivalent to the American one. Great!
I filtered the StatCan table down to ‘Total residential’ and ‘Number of dwelling units-created’. The Canadian building permits table only went back to 2011, so I arbitrarily decided that 2011-2020 was a good enough time period to average over.
On a whim, I decided to compare the four largest Canadian provinces (Ontario, Québec, British Columbia, Alberta) with the four largest U.S. states (California, Texas, Florida, New York) plus Washington which is sort of like, a mirror-universe BC, why not.
I then got population estimates from Table 17-10-0005-01 Population estimates on July 1st, by age and sex and the {NY,CA,TX,WA,FL}POP data series from FRED. By using population figures for each individual year for each given state/province should allow us to account for differences in population growth across different state/provinces.
Finally, I dumped all of these tables into Excel, chopped things around, divided the number of issued permits by the number of people in each state or province, multiplied that number by one thousand, and then finally averaged every year together. You can find the data here.
Concluding thoughts & questions
Are building permits one-to-one with newly built housing?
No. Not every building permit turns into a housing start, and not every housing start turns into a housing completion. Actual finished housing units are some large fraction of the number of issued building permits.
It’s entirely possible that for ex. jurisdiction A approves a lot more housing than jurisdiction B but actually builds a smaller fraction of it.
What does this say about the housing shortage?
The only concrete observation we can make here is that Canadian provinces tend to issue more building permits than American states.
British Columbia may issue three times the permits per capita that California does, but as long as the demand for housing is higher in British Columbia than it is in California, then prices will continue to be out of whack.3
What does this say about NIMBYism?
That said, I think we can also note that while Canadian jurisdictions may have a NIMBY problem, whatever we do experience here is very different from what our American friends are experiencing. Their situation seems to be a lot worse!4
Thanks for reading! You can ping me at phillmv at okayfail.com or @phillmv with questions, comments, or corrections.
-
For what it’s worth, I spent two hours gathering the data, two hours making the graph look pretty, and another three hours writing this blog post. ↩
-
In fact, I later learned that the CMHC’s building starts data builds upon the building permits data. So, it’s all connected. ↩
-
That’s kind of weird, though, right? No shade on BC but California is nice. ↩
-
Canadians will recognize the familiar refrain; sure, we got problems, but at least we’re not America. ↩